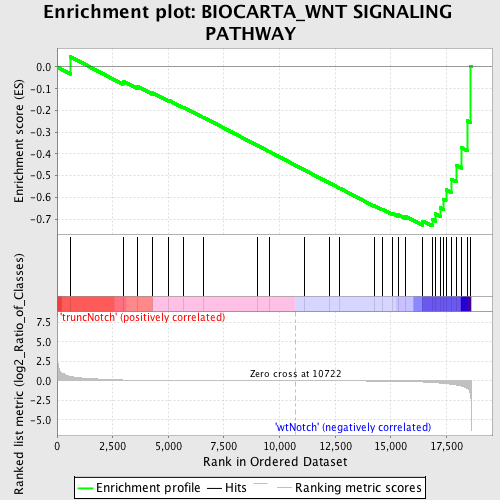
Profile of the Running ES Score & Positions of GeneSet Members on the Rank Ordered List
| Dataset | Set_03_truncNotch_versus_wtNotch.phenotype_truncNotch_versus_wtNotch.cls #truncNotch_versus_wtNotch |
| Phenotype | phenotype_truncNotch_versus_wtNotch.cls#truncNotch_versus_wtNotch |
| Upregulated in class | wtNotch |
| GeneSet | BIOCARTA_WNT SIGNALING PATHWAY |
| Enrichment Score (ES) | -0.731223 |
| Normalized Enrichment Score (NES) | -1.5124869 |
| Nominal p-value | 0.025404157 |
| FDR q-value | 0.5928338 |
| FWER p-Value | 0.996 |
| PROBE | DESCRIPTION (from dataset) | GENE SYMBOL | GENE_TITLE | RANK IN GENE LIST | RANK METRIC SCORE | RUNNING ES | CORE ENRICHMENT | |
|---|---|---|---|---|---|---|---|---|
| 1 | FRAT1 | 780520 2120731 | 607 | 0.556 | 0.0466 | No | ||
| 2 | BTRC | 3170131 | 2963 | 0.109 | -0.0646 | No | ||
| 3 | NKD2 | 1170731 | 3627 | 0.071 | -0.0902 | No | ||
| 4 | KREMEN2 | 110025 | 4284 | 0.049 | -0.1185 | No | ||
| 5 | CTBP1 | 3780315 | 5025 | 0.033 | -0.1536 | No | ||
| 6 | WIF1 | 7100184 | 5667 | 0.024 | -0.1846 | No | ||
| 7 | PPARD | 110131 | 6586 | 0.016 | -0.2317 | No | ||
| 8 | DKK2 | 3610433 | 9026 | 0.005 | -0.3623 | No | ||
| 9 | FZD1 | 3140215 | 9544 | 0.003 | -0.3896 | No | ||
| 10 | DKK1 | 1940215 | 11115 | -0.001 | -0.4739 | No | ||
| 11 | MYC | 380541 4670170 | 12225 | -0.005 | -0.5329 | No | ||
| 12 | PROC | 6520270 | 12691 | -0.007 | -0.5569 | No | ||
| 13 | CSNK2A1 | 1580577 | 14243 | -0.020 | -0.6375 | No | ||
| 14 | WNT1 | 4780148 | 14605 | -0.026 | -0.6532 | No | ||
| 15 | NLK | 2030010 2450041 | 15071 | -0.040 | -0.6726 | No | ||
| 16 | AXIN1 | 3360358 6940451 | 15348 | -0.051 | -0.6801 | No | ||
| 17 | LRP6 | 5130064 | 15662 | -0.071 | -0.6868 | No | ||
| 18 | TLE1 | 540390 1580309 3710019 | 16439 | -0.141 | -0.7084 | Yes | ||
| 19 | NKD1 | 1340286 | 16864 | -0.209 | -0.7014 | Yes | ||
| 20 | GSK3B | 5360348 | 17003 | -0.232 | -0.6758 | Yes | ||
| 21 | HDAC1 | 2850670 | 17220 | -0.280 | -0.6474 | Yes | ||
| 22 | CREBBP | 5690035 7040050 | 17381 | -0.327 | -0.6095 | Yes | ||
| 23 | MAP3K7 | 6040068 | 17481 | -0.352 | -0.5646 | Yes | ||
| 24 | MAP3K7IP1 | 2120095 5890452 6040167 | 17713 | -0.430 | -0.5158 | Yes | ||
| 25 | DVL1 | 5900450 6510162 | 17943 | -0.530 | -0.4526 | Yes | ||
| 26 | SMAD4 | 5670519 | 18179 | -0.658 | -0.3714 | Yes | ||
| 27 | PPP2R5D | 4010156 380408 5550112 5670162 | 18449 | -0.968 | -0.2478 | Yes | ||
| 28 | CCND1 | 460524 770309 3120576 6980398 | 18589 | -1.801 | 0.0015 | Yes |

